![5f31aff63dbd5c7276c1adbb_logo (1).svg]](https://support.genustechnologies.com/hubfs/Genus%20Logos/5f31aff63dbd5c7276c1adbb_logo%20(1).svg)
In order to troubleshoot a problem, Genus support may ask you to capture a browser/network trace from a given webpage.
To do this:
1. Open the webpage in question in Google Chrome
2. Press Control+Shift+I (Windows) or Command+Option+I (Mac) to open DevTools on the page
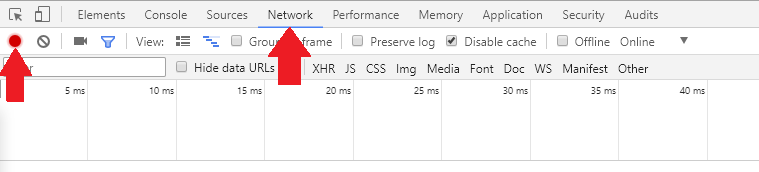
3. In DevTools, click the Network tab. Ensure the Record button is active. If not, click it.
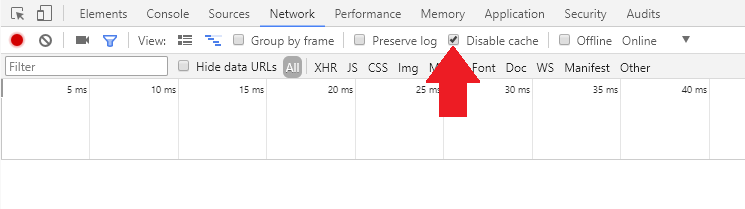
4. Check the Disable Cache checkbox. When this checkbox is enabled, DevTools doesn't serve any resources from the cache. This more accurately emulates what first-time users experience when they view your page. We may also ask you to capture a trace with this setting unchecked.
5. Click the Clear  button to remove any existing requests
6. Press F5, click the Reload  button next to the URL, or Control+R (Windows), Command+R (Mac) to reload the page.
7. Once page finishes loading, click the Stop recording network log  button to stop recording
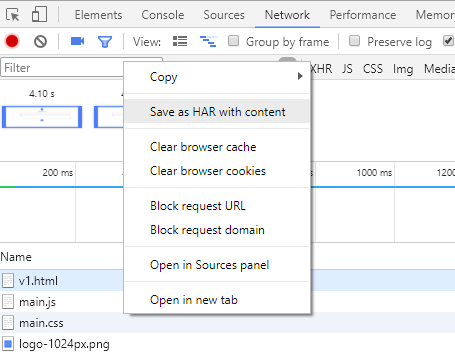
8. Right-click in the bottom frame in DevTools where the browser requests are listed and click Save as HAR with content
10. Save the file and send to Genus
For additional information, see:
https://developers.google.com/web/tools/chrome-devtools/network-performance/reference
https://toolbox.googleapps.com/apps/har_analyzer/